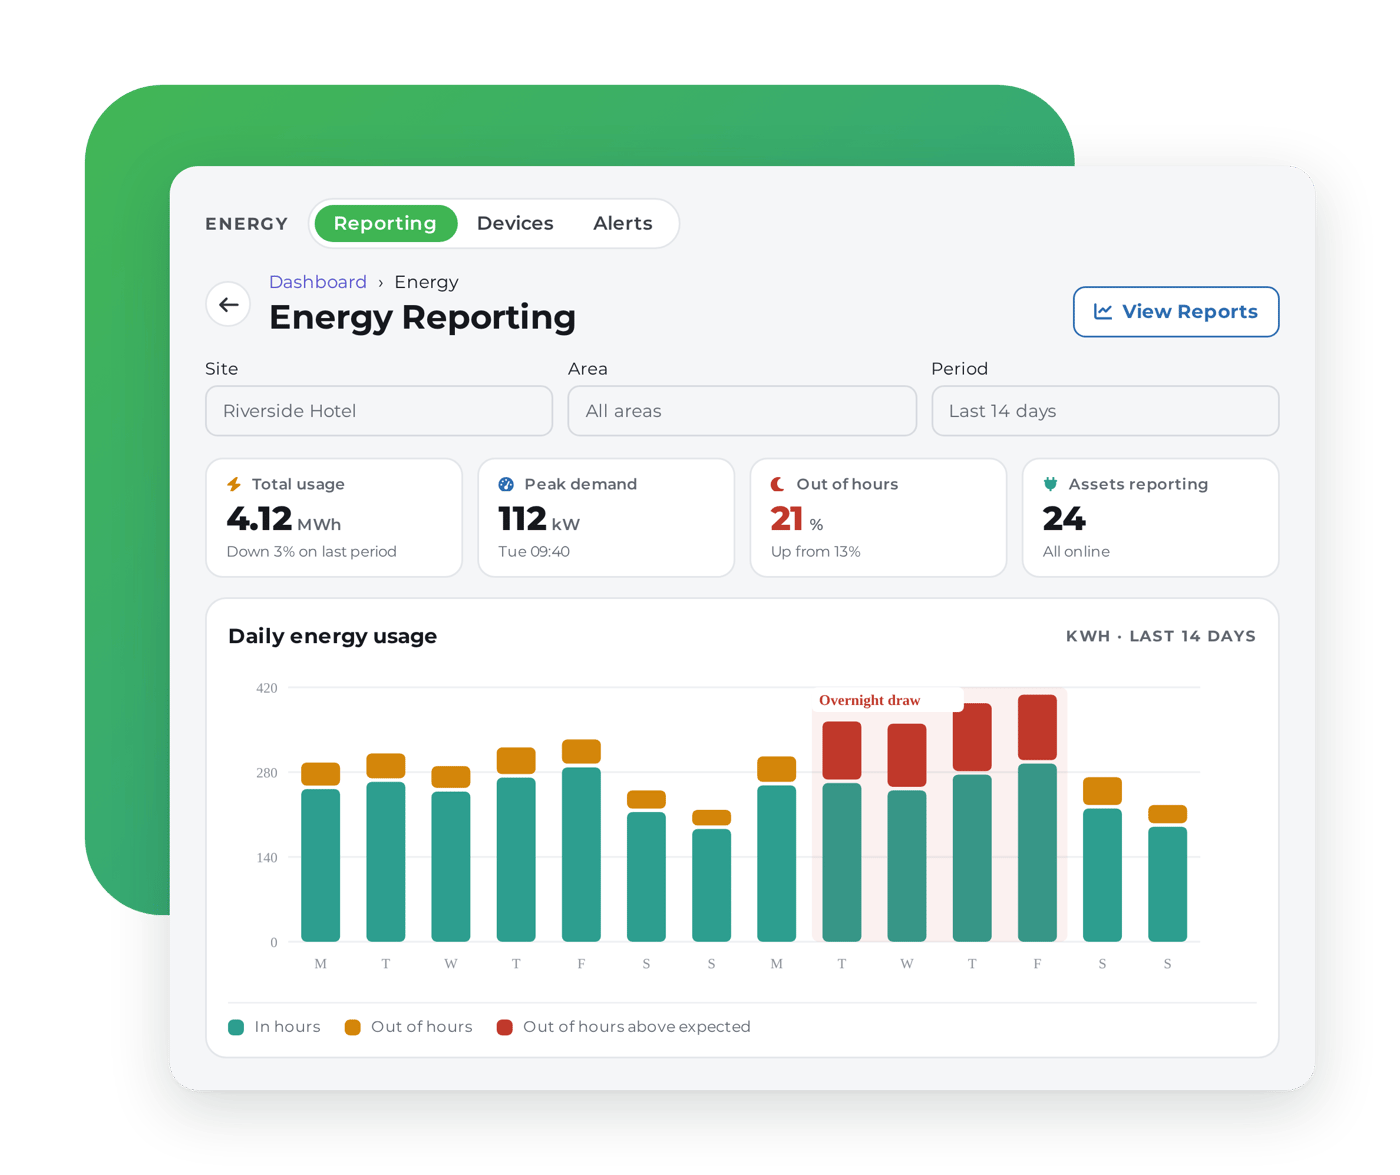
See where energy is being used, wasted and left unchecked.
Ocapii connects smart plugs, smart clamps and energy data into one live operating layer, so teams can see how sites, areas and assets are performing, and where real savings can be made.
Master how your operation uses energy.
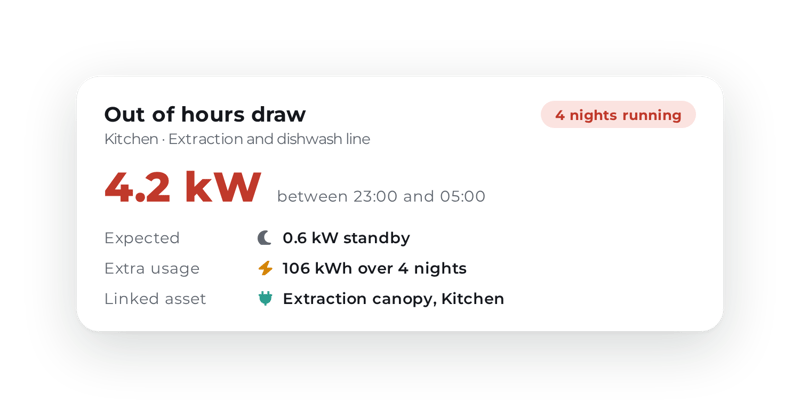
Ocapii brings smart devices and energy data into one live view, showing how sites, areas and assets are performing. It makes spikes, peak demand and out-of-hours usage visible, then links each issue to an owner and action. Hidden energy waste becomes measurable and easier to reduce.
Energy Reporting
Usage and power spikes from energy meters in the selected date range.
Unlinked meters show as Unassigned by device name.
| ASSET / DEVICE | KWH | PEAK W |
|---|---|---|
| Unassigned: Baker Street Fridge | 1.57 | 1,133 |
| Asset #17 | 0.9124 | 936 |
Falls back to location name or Unknown when hierarchy is empty.
| LOCATION | KWH | DEVICES |
|---|---|---|
| Garage | 1.57 | 1 |
| Clinical Room | 0.9124 | 1 |
Readings above the 95th percentile of power (W) in this range, plus any danger-status rows.
| WHEN | DEVICE | LOCATION | POWER (W) | KWH | STATUS |
|---|---|---|---|---|---|
| 13/07/2026 01:41 | Baker Street Fridge | Garage | 1,133 P95 79 W |
0.004719 | UNKNOWN |
| 14/07/2026 01:07 | Victoria Freezer | Clinical Room | 936 P95 79 W |
0.0039 | UNKNOWN |
| 14/07/2026 03:14 | Oxford Circus Fryer | Clinical Room | 88 P95 79 W |
0.000365 | UNKNOWN |
| 14/07/2026 00:05 | King's Cross Heating | Clinical Room | 88 P95 79 W |
0.000365 | UNKNOWN |
| 14/07/2026 04:18 | Paddington Fridge | Clinical Room | 87 P95 79 W |
0.000364 | UNKNOWN |
| 14/07/2026 01:08 | Waterloo Freezer | Clinical Room | 87 P95 79 W |
0.000364 | UNKNOWN |
| 13/07/2026 06:58 | Liverpool Street Fryer | Garage | 87 P95 79 W |
0.000364 | UNKNOWN |
Instantaneous power (W) for Baker Street Fridge between 2026-06-14 and 2026-07-14.
| DEVICE | DEVICE ID | READING | SECONDARY | LOCATION | STATUS | TIME |
|---|---|---|---|---|---|---|
| Baker Street Fridge | AA-BB-CC-DD-EE-FF | 0.000021 kWh | 5.03 W | Clinical Room | unknown | 14/07/2026 16:35 |
| Victoria Freezer | AA-BB-CC-DD-EE-FF | 0.000021 kWh | 4.96 W | Clinical Room | unknown | 14/07/2026 16:35 |
| Oxford Circus Fryer | AA-BB-CC-DD-EE-FF | 0.00002 kWh | 4.90 W | Clinical Room | unknown | 14/07/2026 16:34 |
| King's Cross Heating | AA-BB-CC-DD-EE-FF | 0.000302 kWh | 72.53 W | Clinical Room | unknown | 14/07/2026 16:34 |
| Paddington Fridge | AA-BB-CC-DD-EE-FF | 0.000302 kWh | 72.52 W | Clinical Room | unknown | 14/07/2026 16:34 |
| Waterloo Freezer | AA-BB-CC-DD-EE-FF | 0.0003 kWh | 72.09 W | Clinical Room | unknown | 14/07/2026 16:33 |
| Liverpool Street Fryer | AA-BB-CC-DD-EE-FF | 0.000302 kWh | 72.41 W | Clinical Room | unknown | 14/07/2026 16:33 |
| Bond Street Heating | AA-BB-CC-DD-EE-FF | 0.000301 kWh | 72.35 W | Clinical Room | unknown | 14/07/2026 16:33 |
| Euston Fridge | AA-BB-CC-DD-EE-FF | 0.000301 kWh | 72.30 W | Clinical Room | unknown | 14/07/2026 16:33 |
| Bank Freezer | AA-BB-CC-DD-EE-FF | 0.000301 kWh | 72.28 W | Clinical Room | unknown | 14/07/2026 16:32 |
| Angel Fryer | AA-BB-CC-DD-EE-FF | 0.0003 kWh | 71.90 W | Clinical Room | unknown | 14/07/2026 16:32 |
| Camden Town Heating | AA-BB-CC-DD-EE-FF | 0.000299 kWh | 71.60 W | Clinical Room | unknown | 14/07/2026 16:31 |
Use this token as the X-Api-Key header when devices or gateways post to the IoT ingest cloud function. It is not the same as a Laravel Bearer / M2M API token.
| MAC ADDRESS | DEVICE NAME | DEVICE LOCATION | DATE REGISTERED | STATUS | ACTION |
|---|---|---|---|---|---|
| BC5729142619 | Salad Fridge | Baker Street | 2025-01-26 09:42:47 | Online | |
| BC572914262F | Fridge 3 | Victoria | 2025-02-05 16:34:59 | Online | |
| BC5729142649 | Fridge 2 | King's Cross | 2025-01-25 23:50:48 | Online | |
| 25470263:1 | Fridge 001 | Jack's Kitchen | 2026-07-09 16:10:59 | Offline | |
| BC5729141465 | Freezer 1 | Main Kitchen | 2026-04-16 12:46:59 | Online | |
| 25470263:2 | Feezer 001 | Jack's Kitchen | 2026-07-09 16:10:59 | Offline | |
| BC572914260A | Dessert Fridge | Paddington | 2025-01-25 22:12:07 | Online | |
| BC5729142255 | Prep Fridge | Oxford Circus | 2025-03-02 08:15:22 | Online |
Unlinked meters show as Unassigned by device name.
| ASSET / DEVICE | KWH | PEAK W |
|---|---|---|
| Unassigned: Baker Street Fridge | 1.57 | 1,133 |
| Asset #17 | 0.9124 | 936 |
Falls back to location name or Unknown when hierarchy is empty.
| LOCATION | KWH | DEVICES |
|---|---|---|
| Garage | 1.57 | 1 |
| Clinical Room | 0.9124 | 1 |
Energy waste is rarely obvious from a monthly bill.
The problem is not the size of the bill. It is the gap between energy data and operational action. Waste sits inside the everyday operation, and most teams have no way to see it in time to change it:
- ✓ Equipment left running overnight, long after anyone has gone home.
- ✓ Assets quietly drawing more power than similar units nearby.
- ✓ Sites performing differently from each other for no obvious reason.
- ✓ Areas pulling energy when nobody is there to need it.
- ✓ Teams without the visibility to know where change would make the biggest difference.
See where energy is really being used.
A monthly bill shows total site spend, not where the energy went. Ocapii closes that gap with smart plugs for device-level insight, smart clamps for circuits and operational areas, and connected meters for whole-site performance. Teams can quickly see what is driving costs and where savings can be made.
Fridge
Oven
Split
Machine
washer
Lights
See where energy is really being used.
Granular energy data
Use smart plugs, clamps and connected meters to monitor energy by site, area, circuit or asset.
Live operational visibility
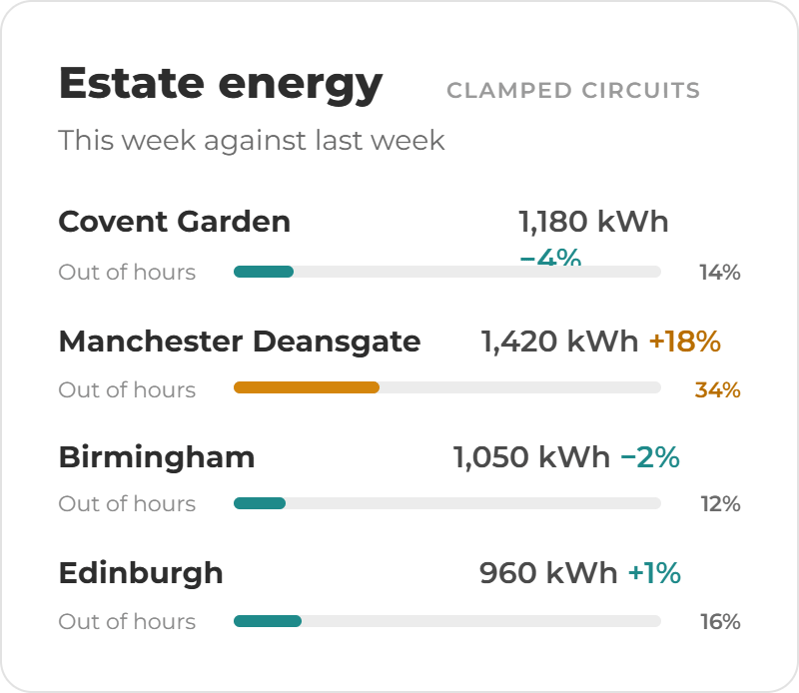
Track kWh usage, demand peaks, spikes, trends, device timelines and estimated cost in one connected view.
Asset-level insight
Understand which equipment uses more energy than expected and where maintenance or replacement is worth reviewing.
Alerts and actions
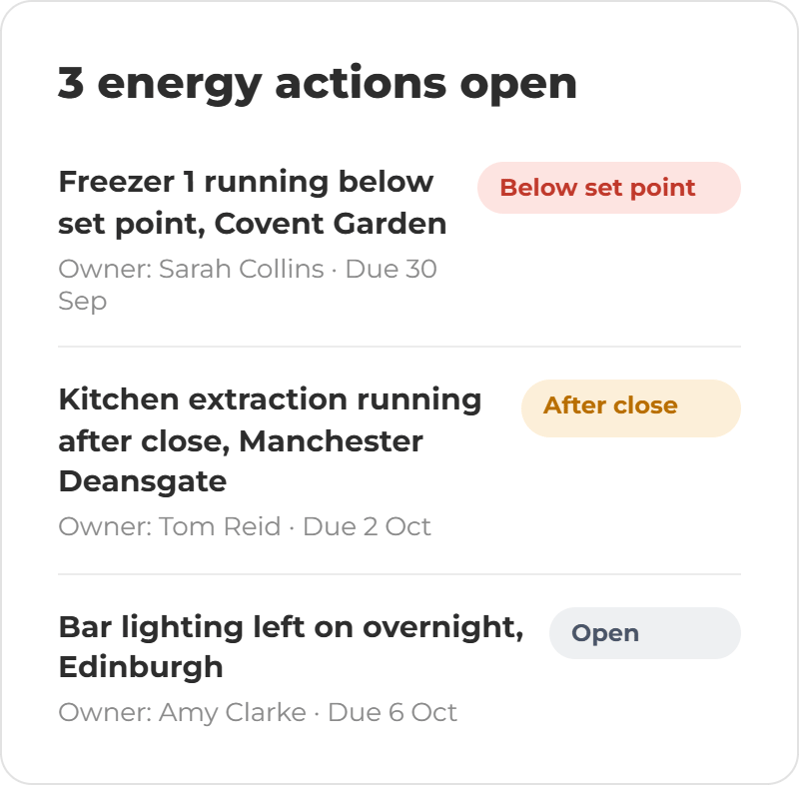
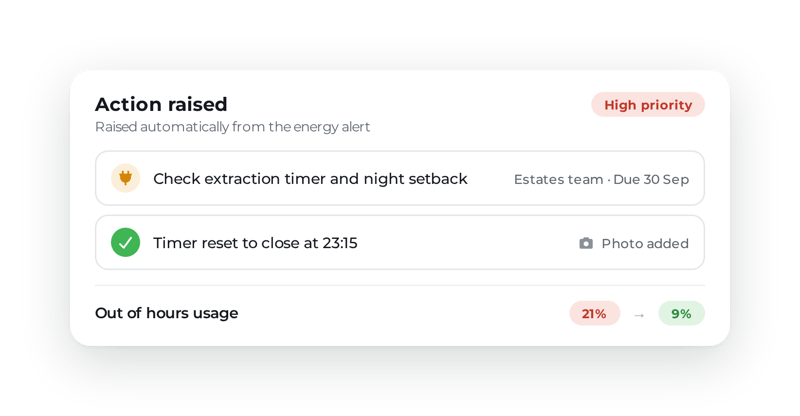
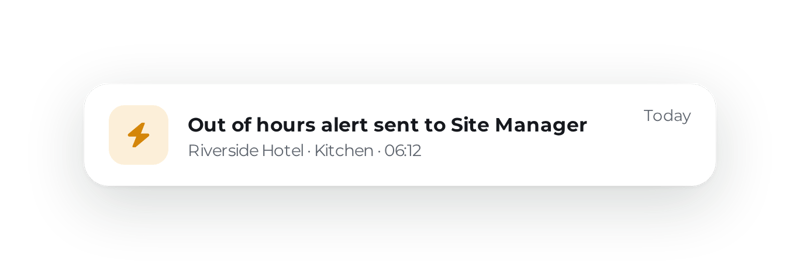
Turn unusual energy patterns into tasks, corrective actions and operational follow-up, where configured.
Multi-site comparison
Compare performance across locations and identify where processes, assets or behaviours drive higher consumption.
Sustainability evidence
Build a clearer record of energy performance, improvement actions and operational change over time.
Unlock the guide.
Most operational guides tell you what a platform can do. This one starts somewhere different. It identifies where the gaps are, what they cost, and what a more connected approach makes possible.
PDF guide
- PDF guide
- 10 min read
- 12 pages
- Operational Guide
A guide which covers a part of your operation that typically runs on a combination of experience, habit, and systems that were not designed to talk to each other.
Get the guide
We never share contact details with third parties. Unsubscribe anytime.
Energy monitoring for buildings, assets and sites that cannot run on assumptions.
Consumption visibility shaped to each sector's assets, operating hours and accountability lines.
Ready to turn energy data into operational action?
Ocapii helps organisations connect energy and building automation data with alerts, workflows, maintenance actions and sustainability reporting across every site.
Energy monitoring common questions
Ocapii can work with energy and building automation data brought in through configured integrations, APIs or monitoring hardware, depending on the customer setup and the systems in place.
Yes. Where configured, energy consumption can be viewed by site, building, asset, circuit, equipment type or operational area so teams can see where demand is coming from.
Yes. Unusual usage, out-of-hours running, spikes or inefficient patterns can trigger alerts, tasks, maintenance reviews or corrective actions for the right team.
Yes. ocapii can support ESG and waste-reduction work with clearer usage trends, exception records, action history and reporting across sites.
Yes. ocapii is designed for single-site and multi-site operations, helping local teams act while giving leaders a clearer view of consumption and improvement across the organisation.
No. ocapii connects energy data with alerts, tasks, maintenance, corrective actions, evidence and reporting. The value is not only seeing consumption, but acting on what it shows and proving the improvement.