Asset Management

Waste patterns show what you couldn't see before

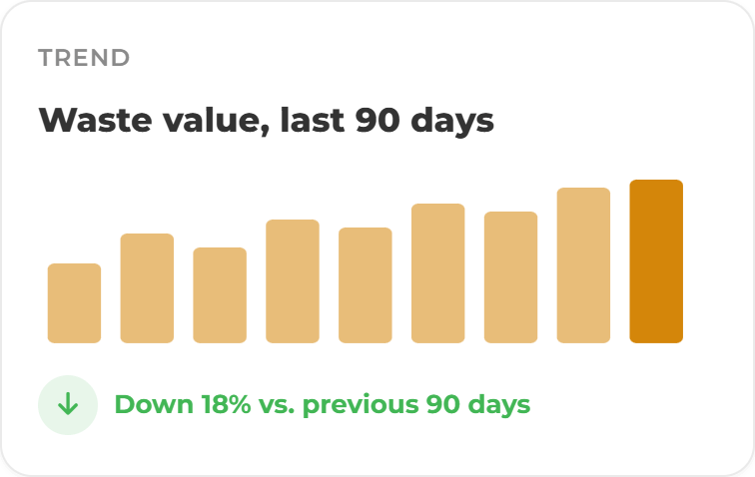
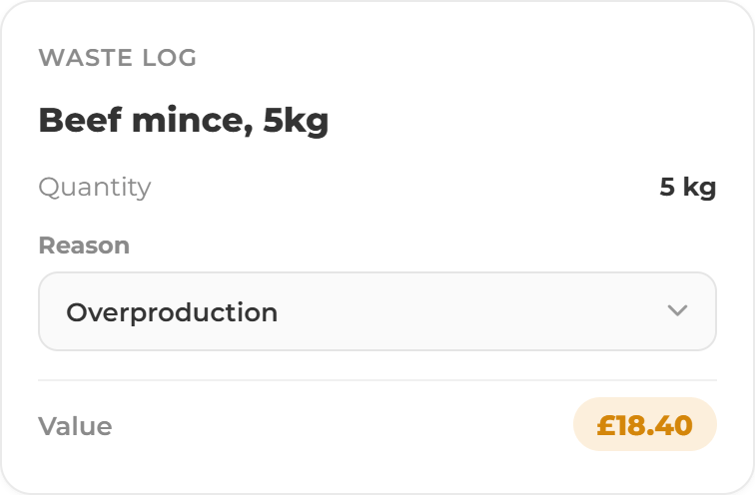
Waste is captured by product, reason, location and value. After a few weeks it stops being a number and starts showing a cause.

Bin Waste Waste & Sustainability Cards- waste log Waste & Sustainability Cards trend Waste & Sustainability Cards- carbon impact Kitchen  (16)
ChatGPT Image Sep 14, 2026, 03_47_17 PM (2) Sustainability Reporting Screens- log waste
What it does

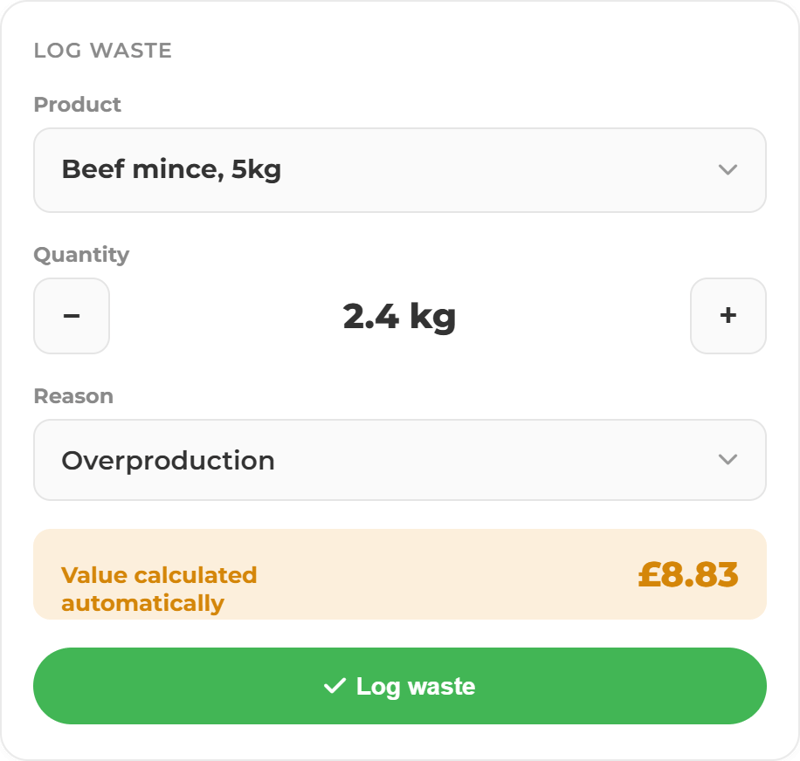
Logging takes seconds

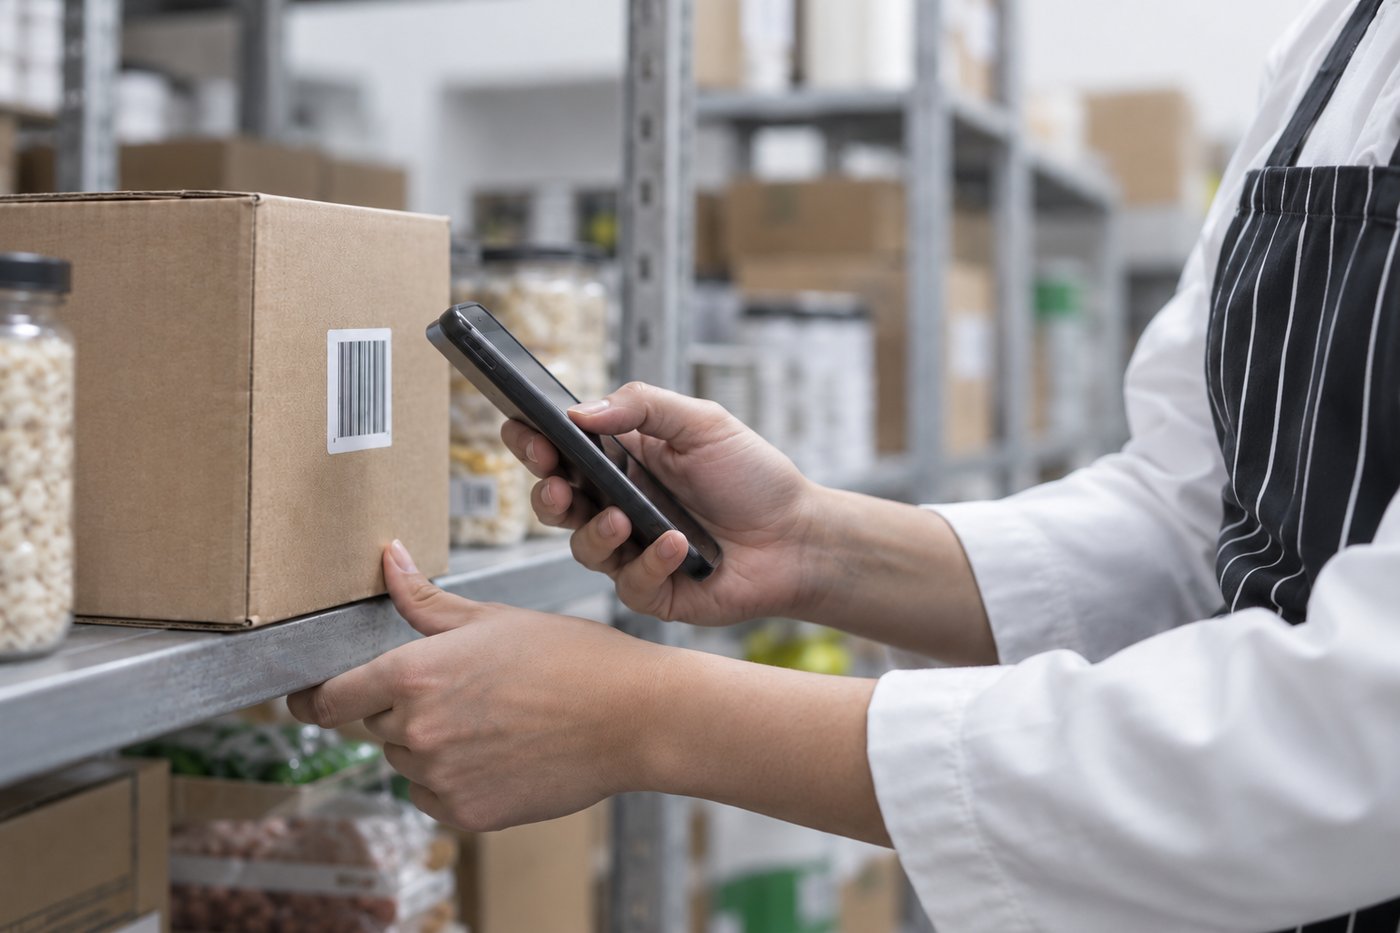
Scan or select the product, enter the quantity, pick the reason. The value is calculated from product data you already hold. 

Waste, energy and stock together

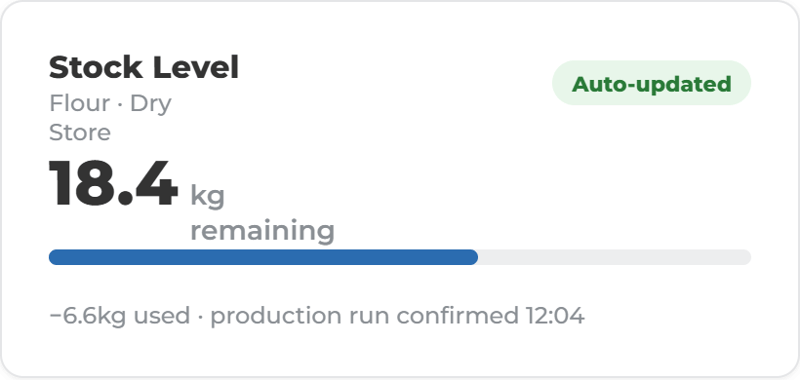
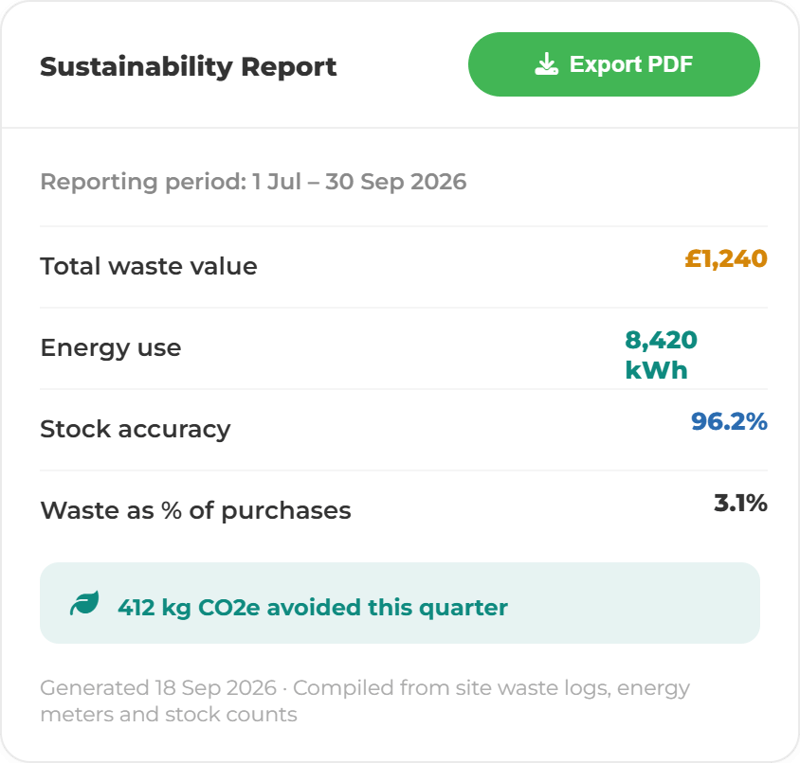
Waste sits alongside energy monitoring and inventory, so the reporting covers the whole cost of running the kitchen. 
Stock Take Dashboard Cards- Stock Levels
ChatGPT Image Sep 14, 2026, 03_39_41 PM Sustainability Reporting Screens- Corrective Action
What it does

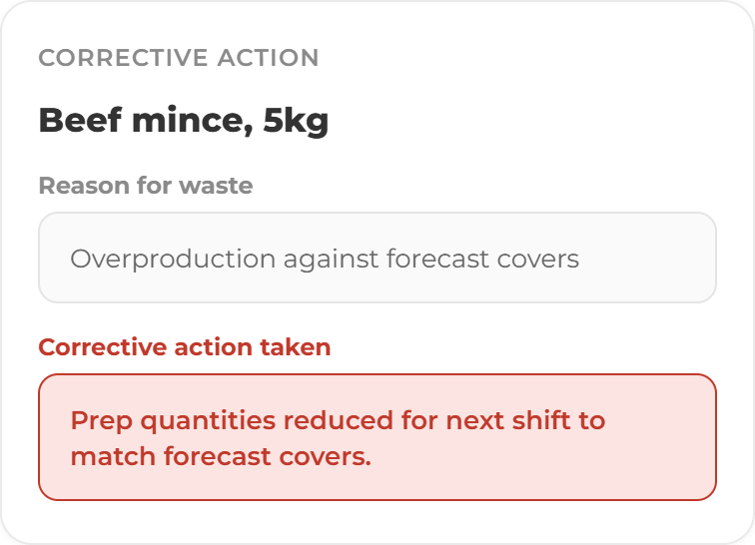
The reason is 'why' the useful bit

Overproduction, spoilage, prep, plate waste and expiry are separated out, so you can see which one to fix. 

What it does

Evidence your ESG reporting can use

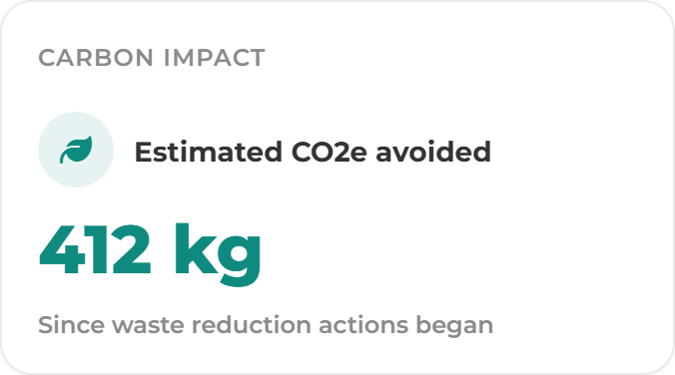
Waste volumes, values and CO2e estimates export with the underlying records behind every figure. 

ChatGPT Image Sep 14, 2026, 10_20_14 AM Sustainability Reporting Screens Report

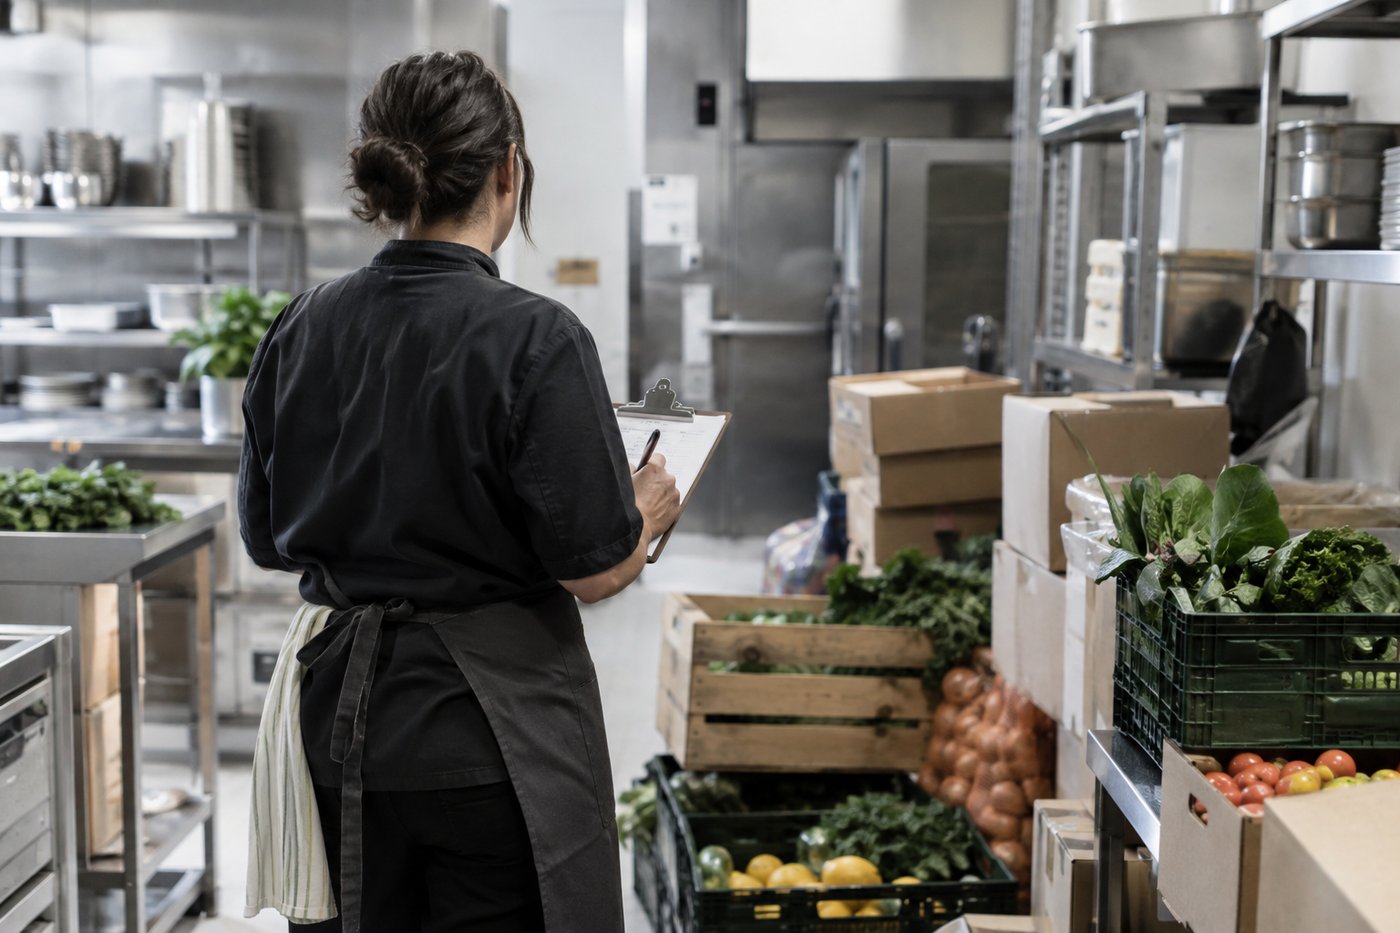
Keep track of food waste in your kitchens.

More ways to use ocapii

Kitchen Fulfliment

Inventory Management

Track stock levels, expiry dates, suppliers, movements, waste and low-stock alerts across sites, departments and locations.

Find out more →
Food Safety

Food Safety

Opening checks, temperatures, cooking and cooling records, taken on a phone in seconds.

Find out more →
Cold Room Temperature Mointoring

Temperature Monitoring

Sensors read fridges, freezers, cold rooms, hot-hold units and medicine fridges around the clock.

Find out more →
FAQ

Food waste reduction commonly asked questions

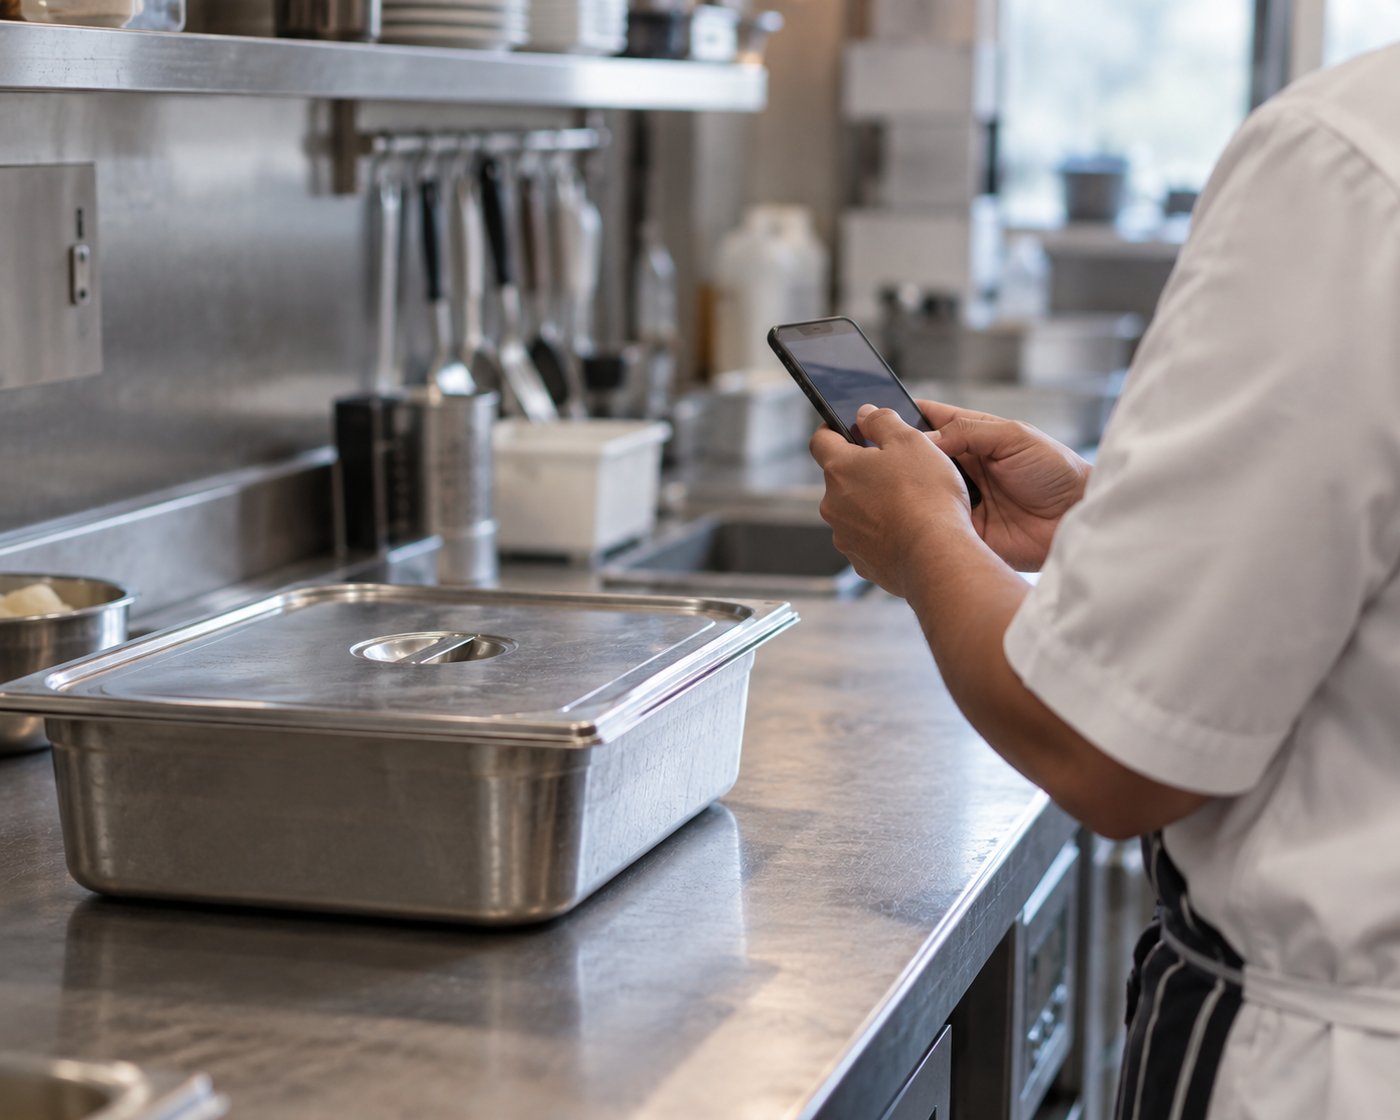
Waste is logged by product, quantity, reason, location and value, either at a station on a tablet or on a phone. The value is calculated from product data already held in the platform.

Yes. Waste volumes, values and CO2e estimates export with the underlying records behind them. How the figures are presented in a published ESG report is a decision for your own reporting team. 

Yes. Waste tracking, energy monitoring and inventory sit on the same platform, so the reporting covers the operation rather than one measure at a time.