-2.png?width=400&name=Untitled%20design%20(4)-2.png)
-1.png?width=400&name=Untitled%20design%20(1)-1.png)
See how people move through your operation.
Connect footfall, occupancy and space utilisation data to alerts, tasks, workflows and reporting across sites, zones and teams.
Site overview — all zones
When footfall is invisible, teams are left reacting.
Many organisations rely on staff observation, customer complaints, manual counts or delayed reports to understand how busy their spaces are. That makes it harder to see where queues, crowding, cleaning demand or underused facilities are building. Leaders may know a site was busy, but not where pressure happened, when it peaked or what action followed.
Live operational visibility connected to action.
Ocapii turns footfall and occupancy data into live operational visibility, helping teams understand demand, spot pressure sooner and manage spaces more effectively. Instead of simply counting people, ocapii connects footfall insight to the operational decisions that shape the day from staffing and cleaning to queue management, space use and site-level planning.
One connected system for footfall, occupancy and action.
Footfall visibility
Track configured people-counting or visitor-flow data across sites, entrances, zones, rooms or operational areas.
Occupancy monitoring
Understand how busy specific spaces are and where occupancy may need attention.
Zone and area insight
Review movement patterns by site, department, floor, facility, queue area, room or configured zone.
Threshold alerts
Surface occupancy levels, unusual activity, queue pressure or unexpected changes where thresholds are configured.
Operational triggers
Turn footfall changes into cleaning tasks, staffing alerts, safety checks, room resets, facilities actions or service reviews.
Dashboards and reporting
Compare trends across sites, zones, time periods and departments to support better planning and decisions.
Better flow. Smarter staffing. Clearer decisions.
Improve service flow
Understand busy periods, queue pressure and high-traffic zones so teams can respond with better timing.
Support staffing decisions
Use footfall trends to inform rota planning, task allocation and operational coverage across sites and departments.
Strengthen safety & control
Surface occupancy thresholds, crowding risks or unusual movement patterns where configured.
Improve space utilisation
See which rooms, areas, facilities or zones are overused, underused or creating operational pressure.
Footfall insight should trigger the next step.
A busy entrance, queue or room does not improve just because it appears on a dashboard. Ocapii turns footfall signals into action, so washroom usage can trigger cleaning, queue spikes can notify a manager, quiet zones can inform staffing, and repeated bottlenecks can surface in reporting. This turns footfall data into live operational control, not just another metric.
Footfall monitoring for spaces that need better visibility.
Footfall patterns shaped to each sector's flow, demand and space-utilisation needs.
Create a clearer trail from footfall pattern to action.
Ocapii brings footfall data, threshold events, tasks, actions and reporting into one connected operational record helping teams understand what changed, where pressure built, who responded and what was completed.
A better way to understand footfall across sites and spaces.
| Manual footfall understanding | OCAPII-connected footfall monitoring | |
|---|---|---|
| Teams rely on observation and feedback | — | ✓ |
| Busy periods are reviewed after the fact | — | ✓ |
| Cleaning demand is based on fixed schedules | — | ✓ |
| Staffing decisions depend on assumptions | — | ✓ |
| Space utilisation is difficult to evidence | — | ✓ |
| Actions sit separately from the data | — | ✓ |
Ready to turn footfall data into operational action?
Ocapii helps organisations connect footfall, occupancy and space utilisation data with alerts, tasks, reporting and evidence across every site.
Unlock the guide.
Most operational guides tell you what a platform can do. This one starts somewhere different. It identifies where the gaps are, what they cost, and what a more connected approach makes possible.
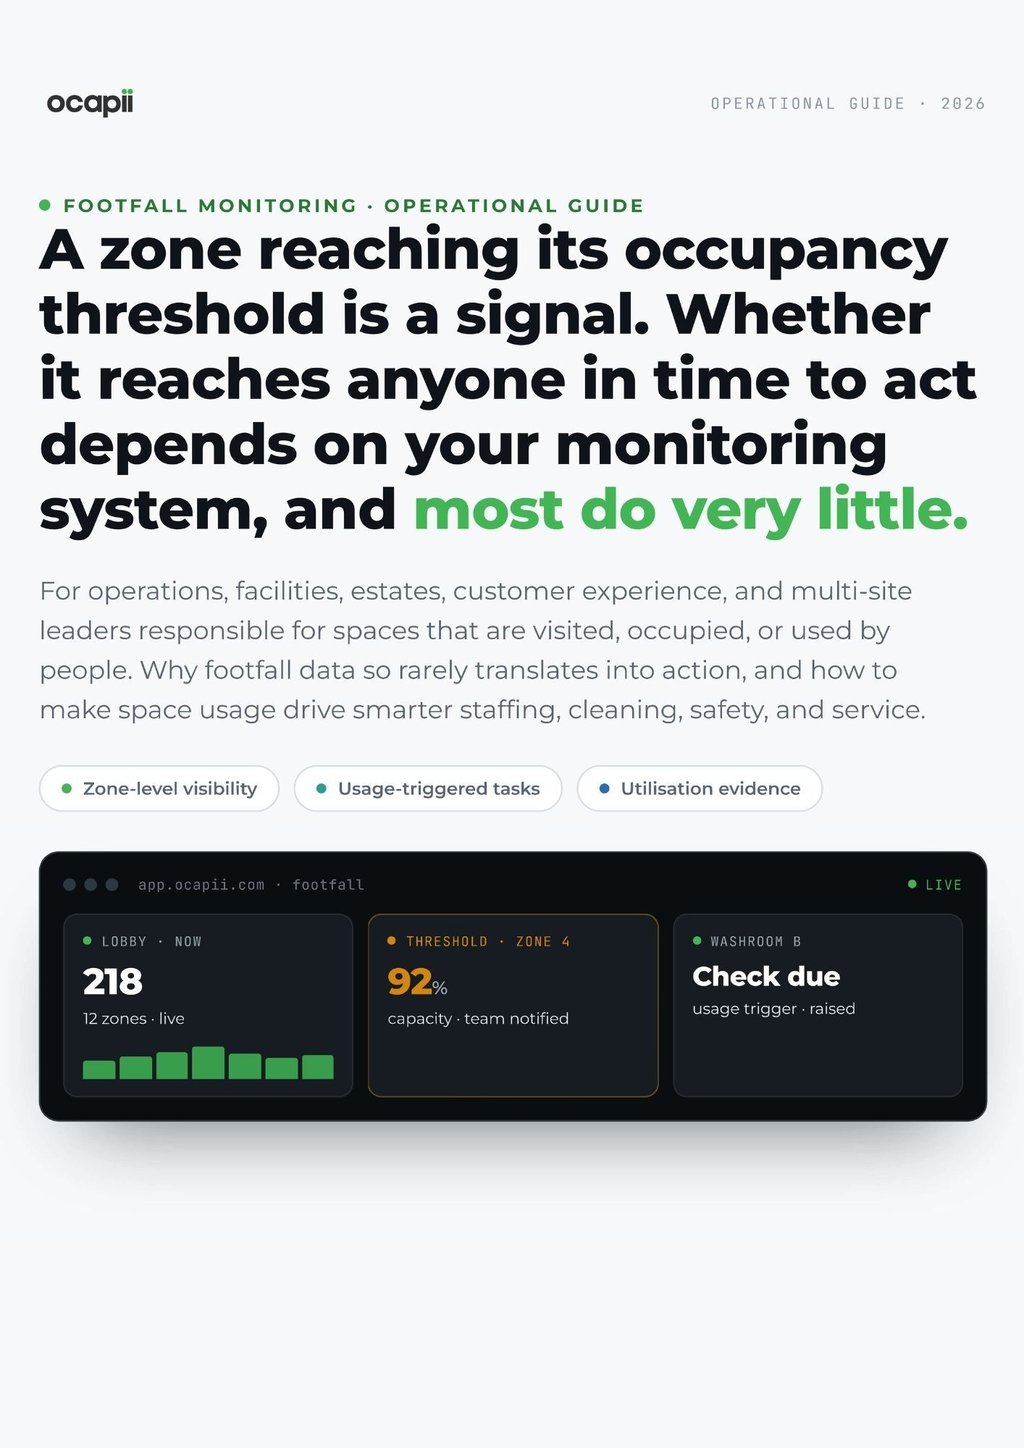 PDF guide
- PDF guide
- 10 min read
- 12 pages
- Operational Guide
A guide which covers a part of your operation that typically runs on a combination of experience, habit, and systems that were not designed to talk to each other.
Get the guide
We never share contact details with third parties. Unsubscribe anytime.
Footfall Monitoring common questions
It means connecting configured footfall, occupancy or visitor-flow data into ocapii so teams can see patterns, trigger workflows and report on how spaces are being used.
No. Ocapii connects footfall data with alerts, tasks, cleaning checks, staffing reviews, safety actions, reporting and evidence. The value is not only seeing footfall, but acting on what it shows.
Yes. Where configured, footfall thresholds or occupancy changes can trigger cleaning tasks, manager alerts, safety checks, service reviews or facilities actions.
Yes. Ocapii is designed for single-site and multi-site operations, helping local teams respond while giving leaders a clearer view of footfall patterns across the wider organisation.
No. This use case stays focused on aggregated footfall, occupancy and space utilisation. It is not positioned around identifying individuals, facial recognition or biometric tracking.
Yes. Footfall data can help teams move from fixed schedules to more responsive cleaning, room checks, washroom checks, facilities reviews and site support where configured.